How I reduced the web application's RAM consumption from 2.65GB to 200MB
 Parmeet Singh
Project overview
Support flagged that the publishing app had started hanging for some accounts. A single tab sat around 2.65GB of RAM, and both CPU and memory stayed high. People assumed the calendar could not handle large schedules.
I was a lead frontend engineer on Meltwater's publishing product. It was a Vue and Stencil web components micro-frontend where social teams draft, schedule, and publish across accounts. FullCalendar sat in the middle of that workflow. The hang was real, but the calendar was not the root cause.

Investigate
I started in Chrome DevTools. I took a heap snapshot on first load, then another after navigating views and opening flows, the kind of session that usually preceded a hang. The second snapshot was full of orphan elements. Nodes had been removed from the live DOM but were still retained in memory. A lot of them lived under the shadow DOM, which made them harder to spot at first.
The Performance tab showed long tasks as red blocks on the main thread. On load there were also network calls that did not need to run until the user navigated somewhere or took an action.

Heap snapshots showed detached DOM nodes still retained after navigation.

Performance traces showed long tasks blocking the main thread.
Rule out the calendar
Because the calendar is heavy and emits thousands of events, I ran a quick check. I stripped it out to see if CPU and memory recovered. They did not. That ruled out the calendar as the root cause and pushed the investigation elsewhere.
Fix the modals
The trail led to modals from our internal components library. They mounted work even when closed, and they did not release memory on close. Opening a modal raised memory. Closing and reopening doubled it. Listeners and detached trees were sticking around after the UI was gone.
I made two changes. First, I lazy-loaded them so they were not part of the initial page cost. Second, I removed their event listeners and related retainers when they closed. That alone brought a tab from about 2.65GB down to around 600MB.
Fix the tags list
A smaller set of accounts still struggled. Those teams leaned hard on the internal tagging system, on the order of 10,000 tags, and the UI rendered the full set in a dropdown. That list alone kept memory and main-thread work elevated.
The tags path was easier to see in production data than in staging, and I could not iterate by shipping repeatedly to prod. I stood up a production-like environment so I could validate against real tag volume without touching live traffic. Then I virtualized the list so only the visible rows mount.
Outcome
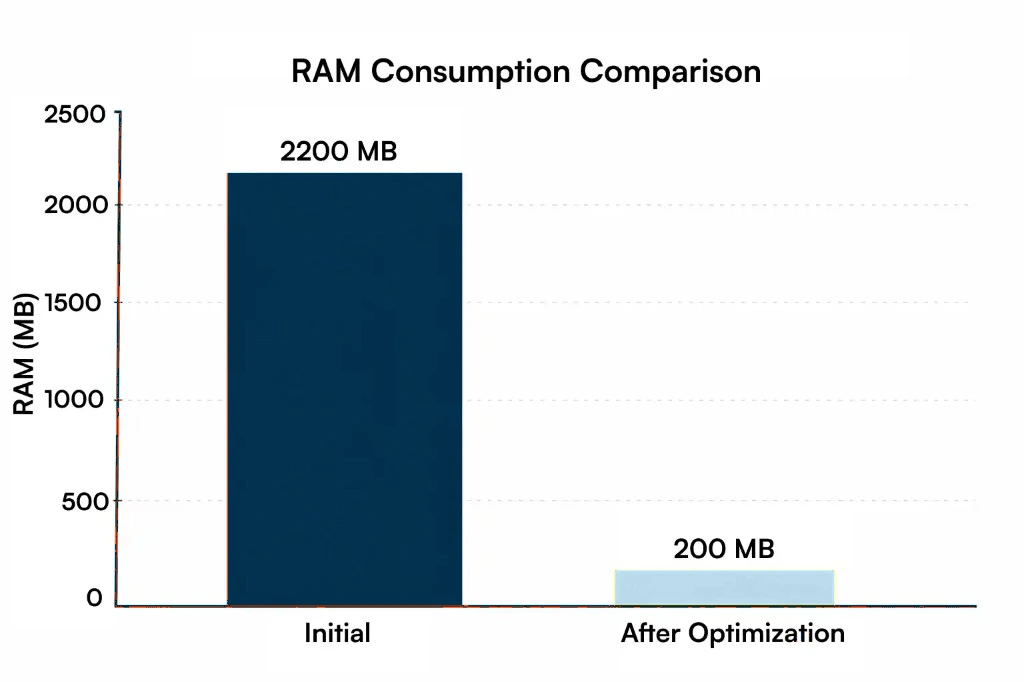
Modal lazy-loading and cleanup was the general fix. List virtualization for the tags dropdown covered the heavy-tag accounts. Together they brought memory down to around 200MB, and it held there with continued use instead of climbing every time someone opened a modal again.
What mattered most was not a single clever patch. It was the path I took. Snapshot before and after, rule out the calendar theory, watch memory stack on modal reopen, then chase the account-specific list that only showed up under real tag volume.
Tech used
Vue, Stencil web components, Chrome DevTools Memory and Performance.


